I. Introduction
A parabola is a U-shaped curve that is symmetrical. It is one of the most common and frequently studied conic sections in mathematics.
Graphing a parabola helps us understand the behavior and properties of this curve and how it can be used to solve problems in various fields such as engineering, physics, architecture, and more.
In this article, we will provide a step-by-step guide on how to graph a parabola, as well as tips and tricks for better graphing and avoiding common mistakes. We will also explore the history and applications of parabolas in mathematics and science and how to use different methods for graphing a parabola.
II. Step-by-Step Guide on Graphing a Parabola
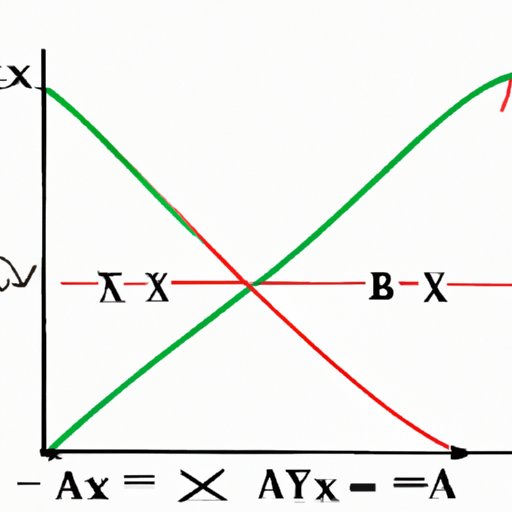
A parabola has three main parts: the vertex, the axis of symmetry, and the focus.
The vertex is the highest (or lowest) point of the parabola, and it lies on the axis of symmetry, which is a vertical line that runs through the vertex. The focus is a fixed point inside the parabola that is equidistant to every point on the parabola.
Here are the steps to graph a parabola:
Step 1: Define the three main parts of a parabola
When graphing a parabola, it is essential to identify the vertex, the axis of symmetry, and the focus. These three parts determine the shape and position of the parabola.
Step 2: Find the vertex and axis of symmetry
To find the vertex, you must first obtain the equation of the parabola. Suppose the equation of the parabola is y = ax^2 + bx + c. Then the coordinates of the vertex are given by (-b/2a, c – b^2/4a).
Once you have the coordinates of the vertex, you can find the axis of symmetry, which is a vertical line that passes through the vertex. The equation of the axis of symmetry is x = -b/2a.
Step 3: Plot the vertex, axis of symmetry, and focus on a graph
Once you have found the vertex and axis of symmetry, you can plot them on a graph. The vertex is a point on the parabola, and the axis of symmetry is a line that passes through the vertex. The focus is a point inside the parabola that is equidistant to every point on the parabola.
Step 4: Plot the directrix and the rest of the parabola
After plotting the vertex, axis of symmetry, and focus, you need to plot the directrix and the rest of the parabola. The directrix is a line that is equidistant to every point on the parabola.
The standard form of the equation of a parabola is y = ax^2, where a is a constant. To graph the parabola, plot some points on the parabola and connect them to form the curve.
III. Tips and Tricks for Better Parabola Graphing
Graphing a parabola can be challenging, but with practice and following these tips and tricks, it can be easier to perfect your graphing.
TIP 1: Check your equation for errors
Before graphing your parabola, check your equation for errors. A small error in your equation can lead to a lot of problems with your graph. Always double-check your equation for accuracy before beginning.
TIP 2: Use graph paper
Using graph paper makes it easier to plot your points and lines accurately. Graph paper allows you to draw your parabola using a scale, which makes it easier to calculate each point’s coordinates on the graph.
TIP 3: Practice makes perfect
The more you practice graphing parabolas, the easier it will become over time. Do not be discouraged by progress and make sure to keep practicing.
TIP 4: Understand the limitations of your equipment
Graphing tools such as calculators and computers may have limitations regarding the precision of the parabola’s axes. Know what your tools can and cannot do before starting your graphing process.
IV. Common Mistakes to Avoid When Graphing a Parabola
Here are some common mistakes people make when graphing parabolas, and how to avoid them:
Mistake 1: Misidentifying the vertex
The vertex is an essential part of the parabola, as it determines the parabola’s position and shape. Make sure you have correctly identified the vertex before continuing with the graphing process.
Mistake 2: Not plotting enough points
Plotting more points on the parabola gives you a more accurate representation of the curve. It is advisable to plot at least three points on the graph to get a good understanding of the parabola.
Mistake 3: Ignoring the axis of symmetry
The axis of symmetry is a vertical line that passes through the vertex and divides the parabola into two equal halves. Ignoring the axis of symmetry means plotting the parabola in the wrong position on the graph.
Mistake 4: Failing to label the axis and coordinate points
Not labeling the axis and coordinate points can lead to further confusion and errors and makes it more difficult when the parabolas generated are complicated.
V. Real-Life Examples of Parabolas in Various Fields
Parabolas are widely used in different fields. Here are a few examples:
Architecture
Architects use parabolas to design arches and domes for buildings. An arch or dome is designed using a parabola as the cross-sectional shape.
Engineering
Engineers use parabolas to design satellites and other objects that need to be launched into space. A parabolic dish is used in radio and satellite communication, and engineers use parabolic reflectors to direct signals and beams of light.
Physics
Parabolic shapes are used in physics to study projectile motion, which describes the motion of objects under the influence of gravity. For example, when you throw a ball, the trajectory of the ball follows a parabolic path.
VI. Graphing a Parabola Using Different Methods
There are various methods for graphing a parabola. Here are two of the most common methods:
Completing the Square Method
The completing the square method is a commonly used method for graphing a parabola. To use this method, complete the square of the quadratic equation to find the vertex and the axis of symmetry. This method is best for graphing complicated parabolas.
Factoring Method
The factoring method is another way to graph a parabola. This method involves factoring the quadratic equation to find the x-intercepts, from which you can find the vertex and axis of symmetry. This method works best for simple, easy-to-factor quadratic equations.
VII. History and Application of Parabolas in Mathematics and Science
Parabolic curves have been studied since ancient times. The Greek mathematician Apollonius of Perga is credited with inventing conic sections in the third century BC, which included the parabola.
Parabolas have many applications in mathematics and science. In astronomy, parabolic orbits are used to study comets and asteroids. In physics, parabolic mirrors are used to focus light and make telescopes and microscopes. In biology, parabolic shapes are used to study animal movements, including bird flight.
VIII. Common Misconceptions about Parabolas and How to Correct Them
Here are some common misconceptions people have about parabolas and how to correct them:
Misconception 1: Parabolas are only used in mathematics
While parabolas are widely studied in mathematics, they have many applications in different fields. Architects, engineers, physicists, and biologists use parabolic curves to solve problems and design solutions in their respective fields.
Misconception 2: Parabolas always face upwards
A parabola can have an upward or downward opening, depending on the sign of the coefficient of x^2 in the quadratic equation. It is crucial to understand the context of the problem before assuming the parabola’s orientation.
Misconception 3: The focus is always outside the parabola
The focus can be either inside or outside the parabola, depending on the coefficient of x^2 in the quadratic equation.
IX. Conclusion
Graphing a parabola is essential to understanding its shape and properties. It is also a useful tool in solving problems in various fields. By following these step-by-step instructions and tips and tricks, one can easily perfect their parabola graphing skills and avoid common mistakes.
Parabolas are widely used in different fields, not just in mathematics. Understanding the history and applications of parabolic curves can help us appreciate their significance in science and technology.
Remember, practice makes perfect when it comes to graphing parabolas. Keep practicing and improving your parabola graphing skills and continue learning more about this fascinating curve.